Log-zilla: I Studied How Datadog and Sentry Work, Then Built My Own With Claude Agents
After deep-diving into Husky, NRDB, and Snuba, I shrank the same architecture down to something that runs on a laptop: a self-hosted log console that eats every localhost service's output. Here's the design, the trade-offs, and how a team of Claude agents wrote nearly all of it.
Aryansh Kurmi
Software Developer
Log-zilla: I Studied How Datadog and Sentry Work, Then Built My Own With Claude Agents
Earlier this month I wrote a deep dive on how Datadog, New Relic, and Sentry ingest trillions of logs. I ended that post with a claim: the architecture scales down — swap Kafka for a lightweight forwarder, ClickHouse for SQLite, the query fleet for one endpoint, and the same skeleton becomes something one person can build in a week.
This post is me cashing that claim. Meet Log-zilla — the kaiju that eats your localhost logs.
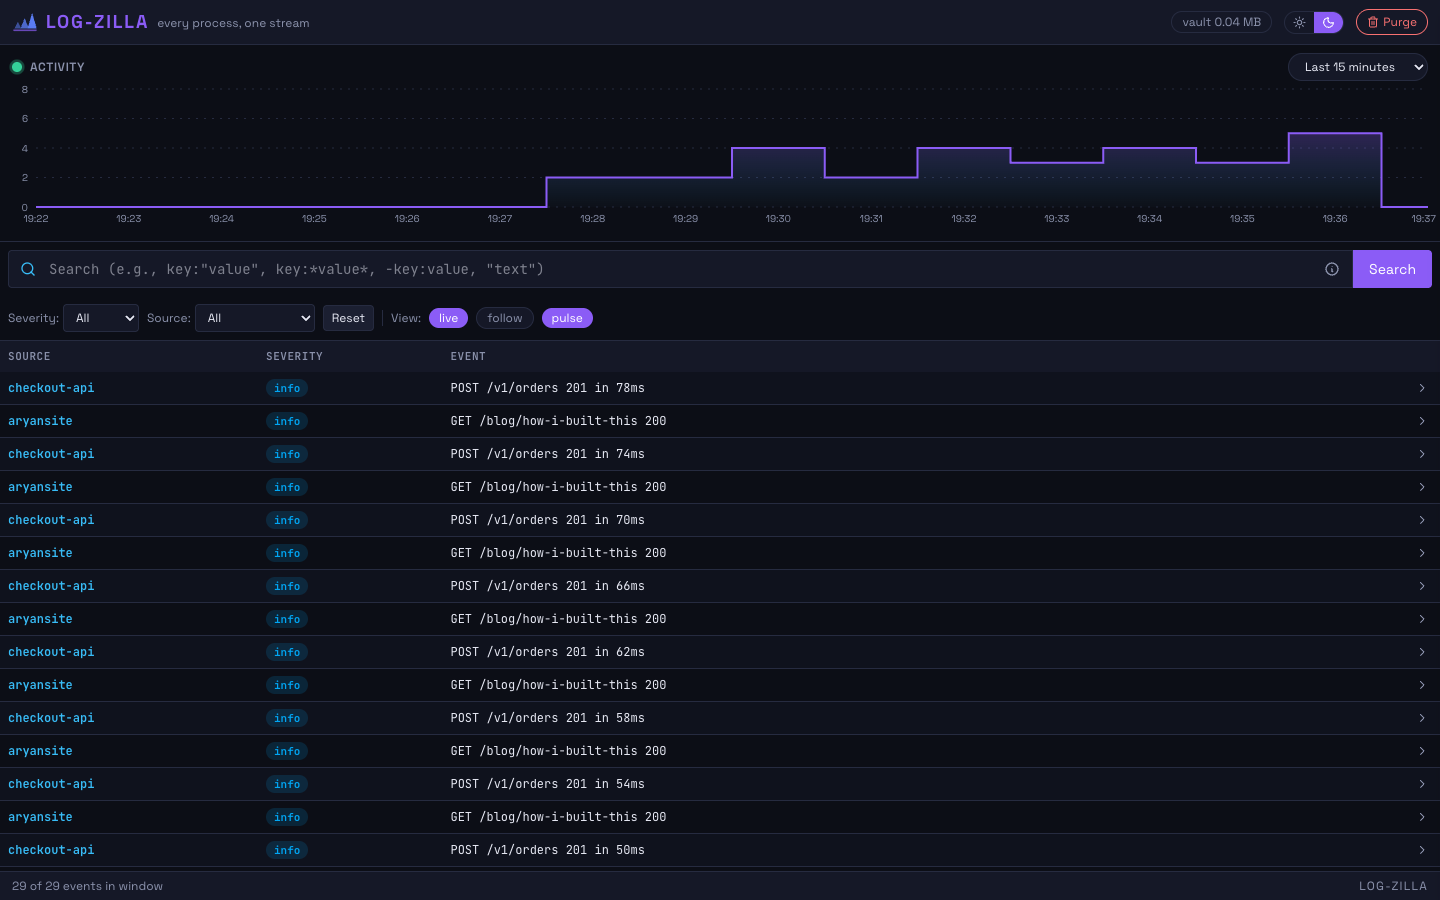
Prefix any command with logzilla — or pipe anything into it — and every service on your machine streams into one searchable console at localhost:5454. Structured search, severity filters, a live activity graph, history that survives restarts. It is, deliberately, a Datadog-shaped machine at 1/1,000,000th the scale.
The other half of the story is how it got built: I wrote almost none of the code by hand. I acted as the architect and reviewer, and a team of Claude agents did the building. More on that below.
The itch
My normal working state is four or five terminal tabs, each running a service — an API, a worker, a frontend dev server, maybe a database container chattering to itself. When something breaks, the evidence is somewhere in those tabs. Usually it scrolled past twenty minutes ago. Usually in the tab I wasn't watching. Terminal scrollback is the worst observability tool ever shipped, and every developer uses it daily.
The tools that fix this properly — Datadog, New Relic — are built for production fleets, priced for companies, and absurd overkill for localhost. The lightweight end of the spectrum (docker logs, tail -f, piping through grep) has no history, no structure, no cross-service view. There's a gap in the middle: production-grade log ergonomics, laptop-grade footprint. That gap is exactly the size of a side project.
And I had just spent weeks studying how the giants do it. The research post wasn't meant as homework for a build, but halfway through writing it I realized I had accidentally produced a spec. Every box in the "universal pipeline" diagram — agent, gateway, buffer, processor, columnar store, query engine — has a laptop-sized equivalent. The design work was already done; the giants had done it for me. I just had to choose the right small thing for each big thing.
Shrinking the giants: the translation table
The whole design of Log-zilla fits in one table — each row is a concept from the big-platform post, translated to its laptop-scale equivalent:
| The giants | Log-zilla | Why this swap works at small scale |
|---|---|---|
| Datadog Agent / Sentry SDK (push) | Fluent Bit + a logzilla CLI wrapper |
Same push model; Fluent Bit is the industry's ~1MB-footprint log forwarder |
| Intake gateway (auth, rate limit) | One HTTP intake endpoint | One tenant (me), one machine — auth and quotas dissolve |
| Kafka (durable buffer, fan-out) | Fluent Bit's built-in buffering | At ~10² events/sec, a distributed commit log is cosplay |
| Stream processors (parse, enrich) | Lua processors inside Fluent Bit | Parsing and severity/service tagging happen before the server ever sees the event |
| ClickHouse / Husky / NRDB | SQLite, indexed on time + source | One writer, append-only, time-ordered — SQLite's happy path |
| Scatter-gather query fleet | One query endpoint + a tiny query DSL | A B-tree index over a few million rows answers in milliseconds |
| Live tail infrastructure | Socket.io pushing to a React/Next.js console | The "seconds-to-queryable" guarantee, via one WebSocket |
| Cells, multi-tenant fairness | Docker container + volume | The blast radius is my laptop |
Two of these rows deserve a defense, because both look like sacrilege.
SQLite instead of a columnar store. The research post argues columnar is the idea — so why row-oriented SQLite? Because the property that makes columnar essential at Datadog's scale (compression and scan cost across trillions of rows) doesn't bind at a few million rows, while the properties SQLite gives me for free — zero operations, a single file I can back up with cp, history that survives restarts, real indexes — are exactly what localhost needs. The deeper lesson from the giants was never "use columnar"; it was append-only, immutable, time-partitioned, indexed on what you filter by. SQLite does all of that. Architecture is about knowing which constraint produced each decision, so you know which decisions to drop when the constraint disappears.
Fluent Bit instead of a hand-rolled tailer. I could have written a hundred-line script that reads stdout and POSTs it. But the agent is the part of the pipeline with the nastiest edge cases — partial lines, multiline stack traces, timestamp formats, backpressure when the server is down — and it's precisely the part the industry has already solved. Fluent Bit is what actual production fleets run at the edge. Using it meant the "agent" box in my diagram had production-grade batching, retry, and buffering on day one, for free — the same reason the giants' agents batch and buffer before pushing.
The pipeline, end to end
Here's the whole machine. If you've read the big-platform post, this diagram should feel like déjà vu — it's the universal pipeline with every box shrunk:
  YOUR TERMINAL                              LOG-ZILLA (Docker, port 5454)
                                             ┌──────────────────────────────┐
  logzilla npm start          batched HTTP   │  ┌────────┐    ┌───────────┐ │
  go run . | logzilla   ────────────────────▶│  │ Intake │───▶│  SQLite   │ │
        │                                    │  └───┬────┘    │ (volume,  │ │
        ▼                                    │      │         │  survives │ │
  ┌────────────┐                             │      │         │ restarts) │ │
  │ Fluent Bit │  parse, tag source &        │      ▼         └─────┬─────┘ │
  │ (embedded) │  severity, buffer, retry    │  ┌────────┐          │       │
  └────────────┘  (Lua processors)           │  │Socket.io│     ┌───▼─────┐ │
                                             │  └───┬────┘     │  Query   │ │
                                             │      │          │  DSL     │ │
                                             │      ▼          └───┬─────┘ │
                                             │  ┌──────────────────▼─────┐ │
                                             │  │  React console: live    │ │
                                             │  │  tail, search, filters, │ │
                                             │  │  activity graph, themes │ │
                                             │  └────────────────────────┘ │
                                             └──────────────────────────────┘
A few design decisions worth narrating:
Service identity comes from the working directory. Datadog's agent tags every event with host and service metadata so the platform can tell tenants and services apart. Log-zilla's equivalent: run logzilla npm start inside payments-service/ and every line is tagged payments-service — zero configuration, and the console auto-discovers a new stream the moment a new service starts talking. The best config is the config you never write.
The write path never blocks the read path. Straight from the giants' playbook: the intake path acks fast and stays decoupled from the UI. Events land in SQLite in batches; Socket.io fans them out to any open console. If no browser is open, nothing is wasted; if three are open, they all stay live. My "ingest-to-queryable" latency is well under a second — which feels magical until you remember I have exactly one tenant and the "queue" is a function call.
History is a feature, not an afterthought. The single biggest ergonomic win over terminal scrollback: the SQLite file lives on a Docker volume, so logs survive restarts of the server and of the services being watched. This morning's stack trace is still there after lunch. There's a Purge control for deleting by source and age — because on a laptop, you are also the retention policy. (That's the storage-tiering section of the big post, collapsed to one button.)
Everything ships as one container. docker run, mount a volume, done. The quick-start script builds the image, starts the server, installs the CLI, and prints usage — the whole platform is one process plus one file.
The console and the query DSL
Storage is table stakes; the console is the product. The bar I set: finding a log line in Log-zilla should feel closer to Datadog's log explorer than to grep.
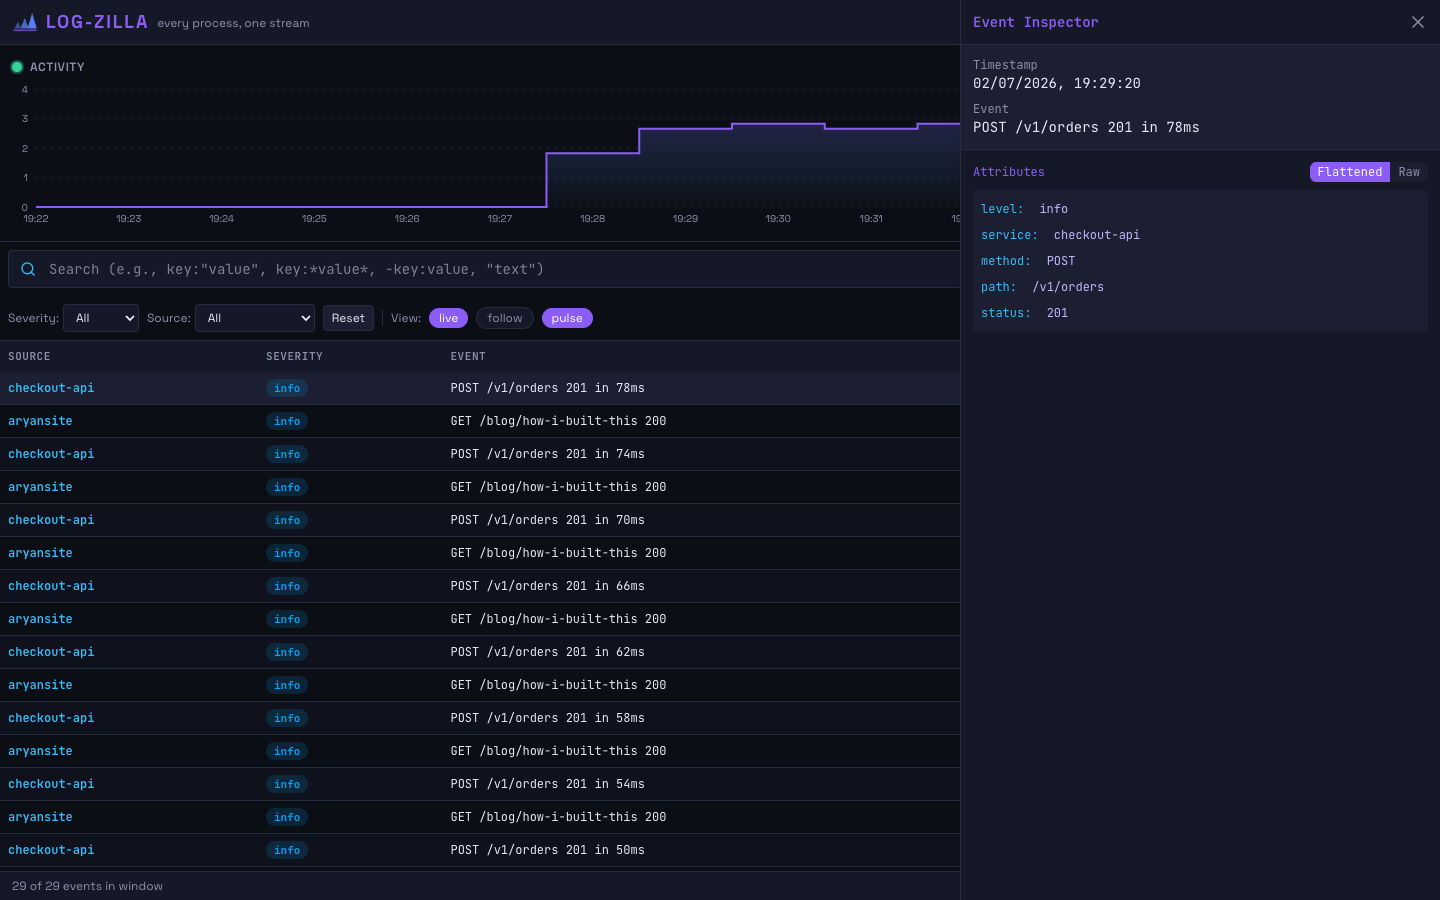
Click any event and an inspector opens with the structured view — every attribute copyable, and every attribute convertible into a filter with one click. That one interaction is quietly the most Datadog-like thing in the project: you never type your first filter, you click your way into it from a concrete example, then refine.
Refinement happens in a small query DSL:
| Query | Matches |
|---|---|
key:"value" |
field equals value |
key:*value* |
field contains value |
-key:value |
field does not equal value |
"text" |
any field contains text |
"a" "b" |
both terms, in any fields |
Designing this was a lesson in restraint. The first instinct is to expose something SQL-shaped — powerful, and utterly wrong for the debugging loop, where you're iterating on a filter every few seconds while half your brain holds the actual bug. Key-value pairs, wildcards, and negation cover essentially every real query I make against local logs. It's a deliberately tiny subset of Datadog's search syntax — and the muscle memory transfers in both directions.
Around the search sit three toggle pills that control the console's relationship with time: live (auto-refresh as events arrive), follow (pin the scroll to the newest line), and pulse (the activity graph across the top). The activity graph earns its pixels: a spike in the error band is visible peripherally before you've read a single line — the same "aggregate first, drill down second" pattern that makes real observability dashboards work.
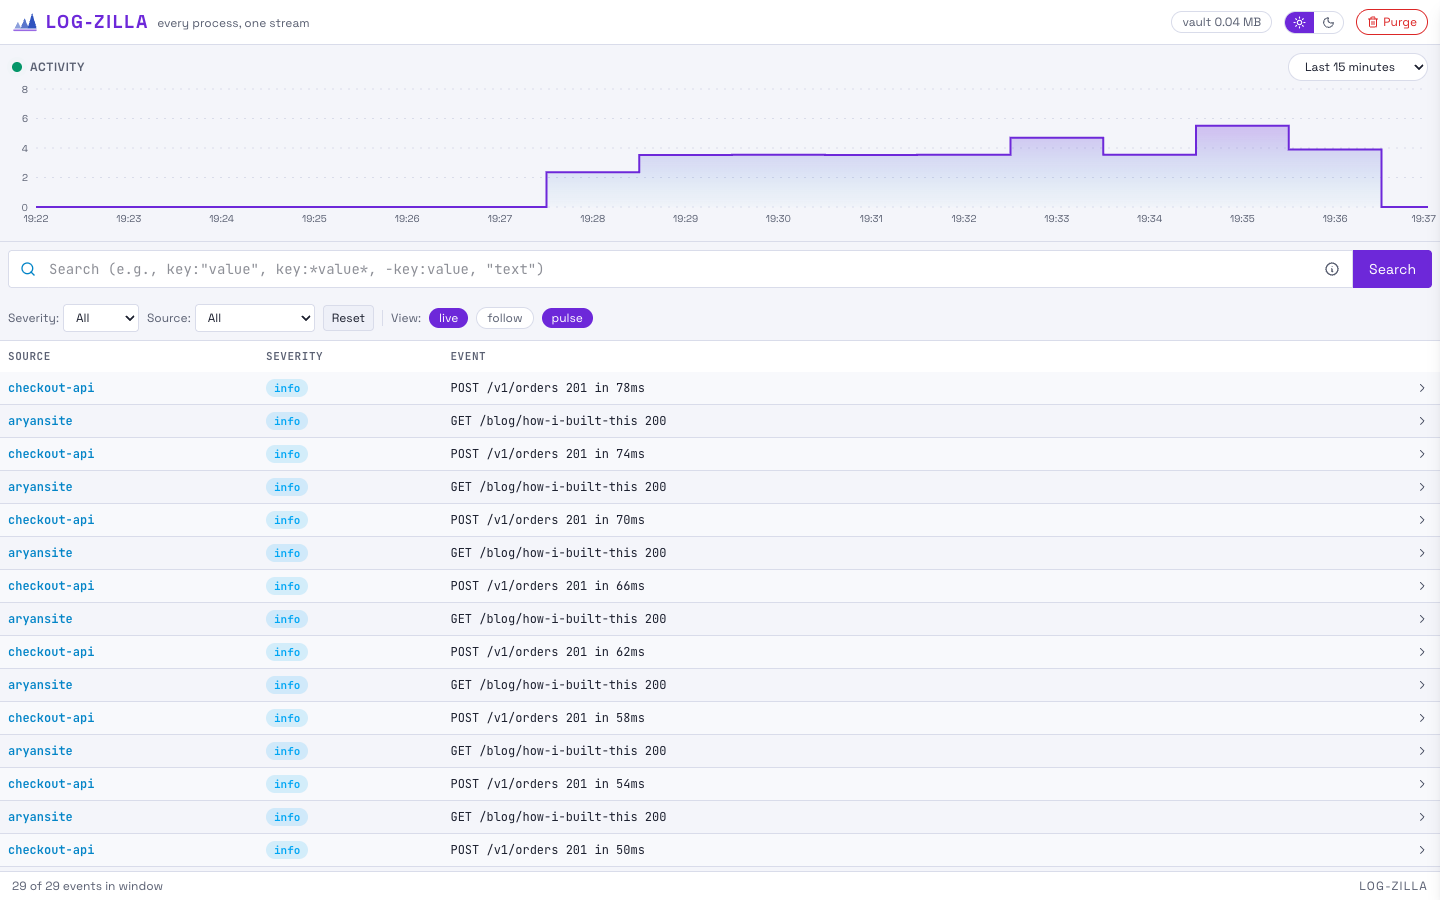
And yes, a proper light theme, because a log console gets stared at for hours and disagreeing with your own tool's aesthetics is a real productivity tax. The sun/moon switch lives top-right.
How Claude agents actually built it
Here's the part that changed how I work: I wrote almost none of Log-zilla's code by hand. The project was built agentically — me as architect, product owner, and reviewer; Claude agents as the implementation team. Not one monolithic "write me a log viewer" prompt, but a structured workflow with specialized agents, the same way you'd staff a small team.
The spec came first, and the spec was mine. The research post plus the translation table above became the working spec: components, boundaries, the data flow, what each piece owns. This is the step people skip when agentic coding goes badly. An agent given "build a log dashboard" produces a plausible-looking demo with the architecture of a hackathon project. An agent given "Fluent Bit tags and forwards; the intake endpoint only writes; SQLite is the single source of truth; the console never queries anything but the query endpoint" produces the system you designed. Agents amplify the clarity — or the vagueness — of what you hand them.
Work was decomposed into agent-sized phases. The pipeline decomposes on exactly the boundaries in the diagram: the forwarding layer, the intake path, the storage layer, the query DSL, the live-tail wiring, the console UI, the Docker packaging, the CLI scripts. Each phase went to an agent as a self-contained brief — what to build, what it's allowed to touch, what "done" means — and ended in its own clean commit. Small phases matter for the same reason small PRs matter, plus one more: an agent, like a new team member, does dramatically better work when the task fits in its head all at once.
A planning agent went first, and review agents went last. Before implementation, a planner agent turned each brief into a concrete plan — files, interfaces, edge cases — which I sanity-checked before any building started. Catching a wrong assumption at the plan stage costs one paragraph of correction; catching it after is a rewrite. After implementation, separate review agents — ones that had no stake in the code just written — went over each phase for correctness and design smells, and a fresh pair of agent eyes reliably caught things the implementing agent was blind to. If that sounds like plan review and code review from ordinary engineering — that's the point. The rituals survive; the teammates changed.
My job was the judgment calls. Every trade-off in this post — SQLite over a "cooler" store, Fluent Bit over hand-rolling, the DSL staying tiny, working-directory service names — was a decision I made and the agents executed. The agents were consistently excellent at the how and consistently indifferent to the should. That division of labor is, I think, the actual shape of this new way of building: the human owns the constraints and the taste; the agents own the typing.
The punchline is the ratio. Log-zilla — forwarder integration, storage, a query language, a real-time console, theming, Docker packaging, install scripts, documentation — was built in days, not weeks, as an evenings-and-weekend project. The bottleneck was never code generation; it was me deciding what I wanted clearly enough to brief it.
What I'd tell you to steal
- Study a giant, then shrink it. "Read how Datadog works, build the laptop version" taught me more about observability than either the reading or the building would have alone. The translation table — big thing → small thing → why the swap is safe — is where the learning lives. Steal the format for any domain.
- Constraints are the deliverable. In agentic development, the highest-leverage artifacts are the spec, the phase boundaries, and the definition of done. Get those right and the code almost writes itself — literally, these days.
- Keep the boring rituals. Plan before building, review after, one concern per phase, one clean commit per phase. Agents don't make engineering discipline obsolete; they make it the only part left that's genuinely yours.
Log-zilla is open source — code, Docker setup, and the quick-start script are on GitHub. Run logzilla npm start on your messiest multi-service project and let the kaiju eat.